Our new parks are just wrapping up their 2019 first quarters, and we could not be more excited about their performance.
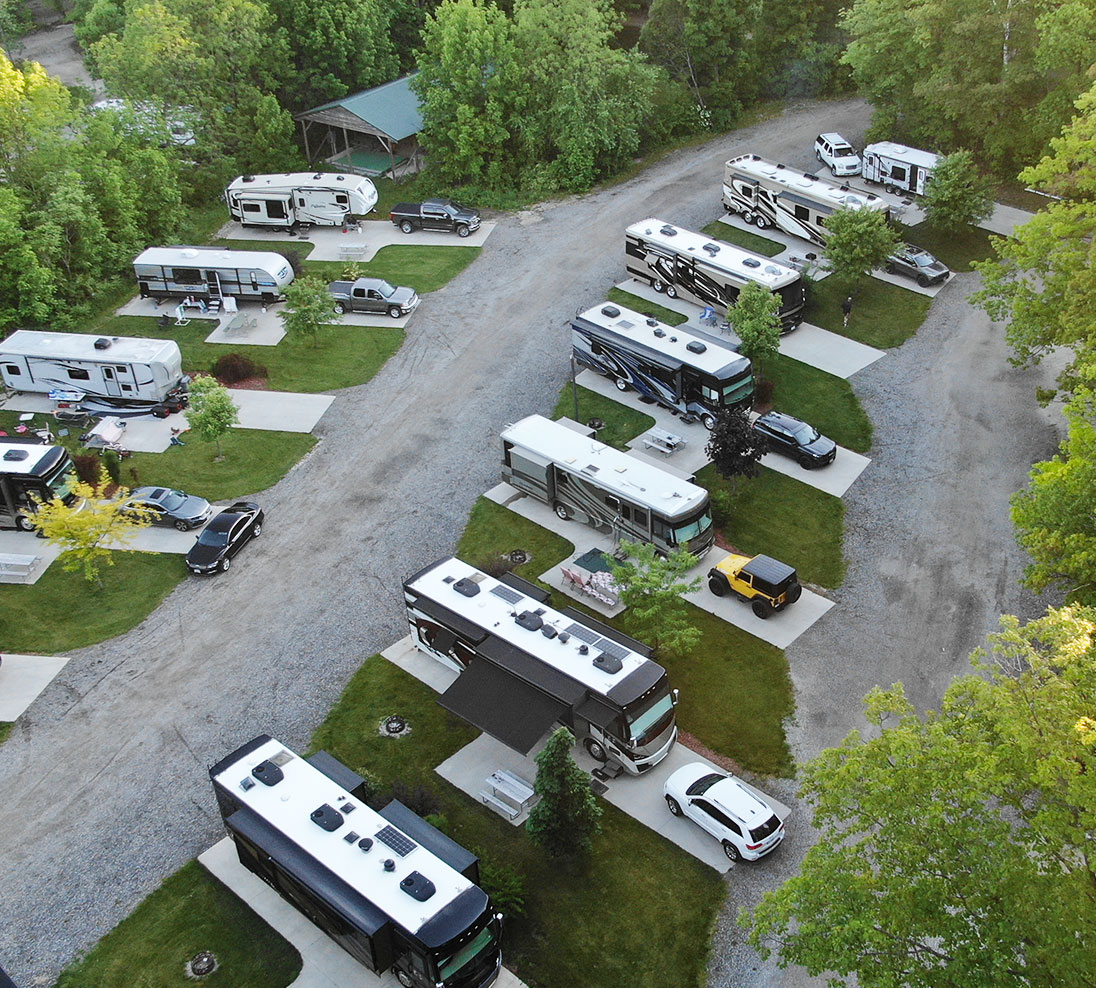
The following case studies are year one AOS parks. They are spread throughout the United States and range from 40 to 300 sites.
Clearly, they benefited from the work our team put into their properties. Our marketing team, revenue management staff, and our regional managers can all give themselves a big high five over these results!
Quarter One 2018 versus 2019…Boom!
2018 Prior to AOS 2019 Post AOS Overall Increase
Property A $175,952 $244,100 $68,148
Property B $110,772 $228,422 $117,650
Property C $126,363 $190,444 $64,081
Property D $138,038 $177,977 $39,939
Property E $31,703 $70,692 $38,989
Property F $16,645 $74,958 $58,313
Property G $90,774 $113,048 $22,273
Property H $93,076 $110,408 $17,332
AOS Value To These Clients -Quarter One $426,725
Read also

Business Advice
Key Principles of Effective Revenue Management

Business Advice
Math That Works; Amenities = Rate + Occupancy